
Q1 2026, Bozeman Homes Cost $829,000
Days on Market ⇑ (41) – Sales Prices ⇓ – Inventory ⇑ (237) – Bozeman Absorption Rates
Bozeman Housing Prices Declining (Building Continues, Overbuilding Probable)
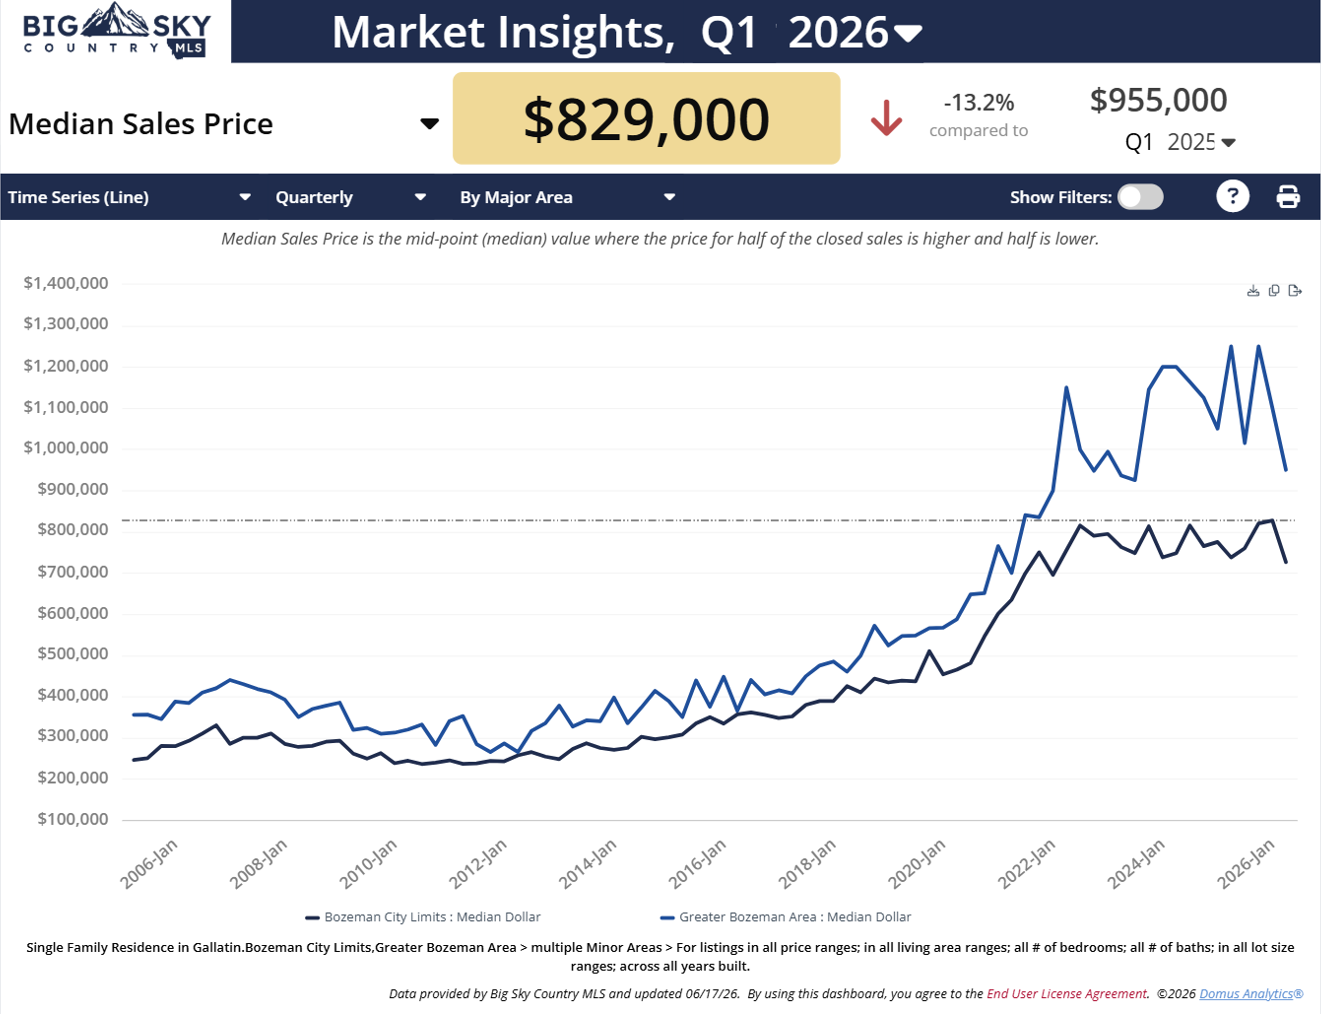
Chart 1: All Bozeman: Q1 2026 median home price is $829,000, ⇓ $126,000 or ⇓ 13.2% from the Q1 2025 median price of $955,000.
In May 2026, the median home price inside the city of Bozeman is $790,000, up ⇑ $75,000 or ⇑ 9.5% from June 2025’s $715,000.
Also in May 2026, outside Bozeman city limits, median home price is $1,095,000, ⇓ $5,000 or ⇓ .5%, from June 2025’s $1,100,000.
Looking at all 2025, median price was $922,500, down a bit, ⇓ $2,500 or ⇓ .3% from 2024’s median of $925,000.
Looking Back at the year 2024, the median price of $925,000, ⇑ $25,000 or ⇑ 2.7% from 2023’s $900,000 median price.

Median home prices had been increasing for over 10 years, but after Q2 2022, they hovered around the $900,000 range.
In 2025 the median price fell into the low $800,00 range by the end of the year.
Inventory in June 2026 is 237 homes for sale in Bozeman.
Percent of List Price (PLP)
Chart 2: Average Percent of List Price: Q1 2026 is 97.6%, Q1 2025 it was 96.9%; Q1 2024, 96.7%.
In Q1 2023, 97.3%; Q1 2022, 100.3%; Q1, 2021, 100.5%; and in Q1, 2020, 98.5%.
In December 2020, the PLP for Bozeman single-family homes hit 100%, for the first time.
The recent history of high percentages of list price is a testament to Bozeman’s housing boom.
Recent Bozeman Housing Records
The first quarter of 2021 began the steepest rise in Bozeman home prices in Bozeman’s history; this ended a year later in Q1 2022.

From Q1 2021 to Q1 2022, Bozeman home prices rose from $660,000 to $900,500. This was an increase of ⇑ $240,500 or a ⇑ 36.4% increase in one year.
Looking Back: Q1 2020 through Q1 2025
Inside Bozeman City Limits, Q1 2020’s median home price, $465,000 was lower than Q1 2021’s, $635,000; this was below Q1 2022’s, $755,000.
The Q1 2023 price was higher, at $762,500, 2024’s Q1 price was down to $749,000, and Q1 2025’s $737,450 price was even lower.
Outside Bozeman City limits: Q1 2020’s median home price, $587,500 was lower than Q1 2021’s, $699,750. This was significantly lower than Q1 2022’s price of $1,150,000.
The Q1, 2023 price was $938,000. In Q1, 2024 price outside the city was up significantly to $1,200,000, but the 2025 price was down to $1,050,000.
Bozeman Home Sales History
Chart 3: In Q 1 2026, the number of homes for sale throughout Bozeman was 237; Q1 2024, it was 239; Q1 2023, 230.

In Q1 2022, inventory was 107 homes, Bozeman’s lowest number of Q1 listings in decades.
The 2022 high was in Q3, which saw 407 homes for sale in Bozeman.
Days On Market (DOM)
Chart 4: In Q1 2026 Days on Market (DOM) was 41, last year–Q 1 2025–it was 49.
In Q1 2024, DOM in Bozeman was 17. In Q1 2023, DOM for a home was 25 days.
In Q1 2022, DOM for homes hit its lowest ever, 4.
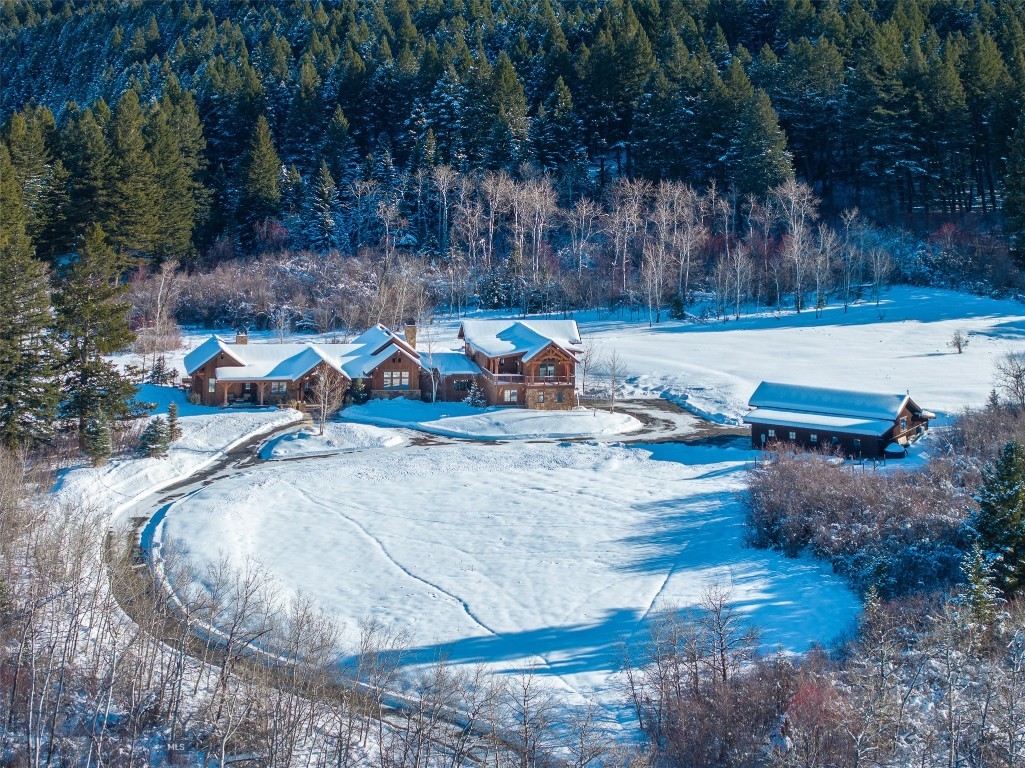
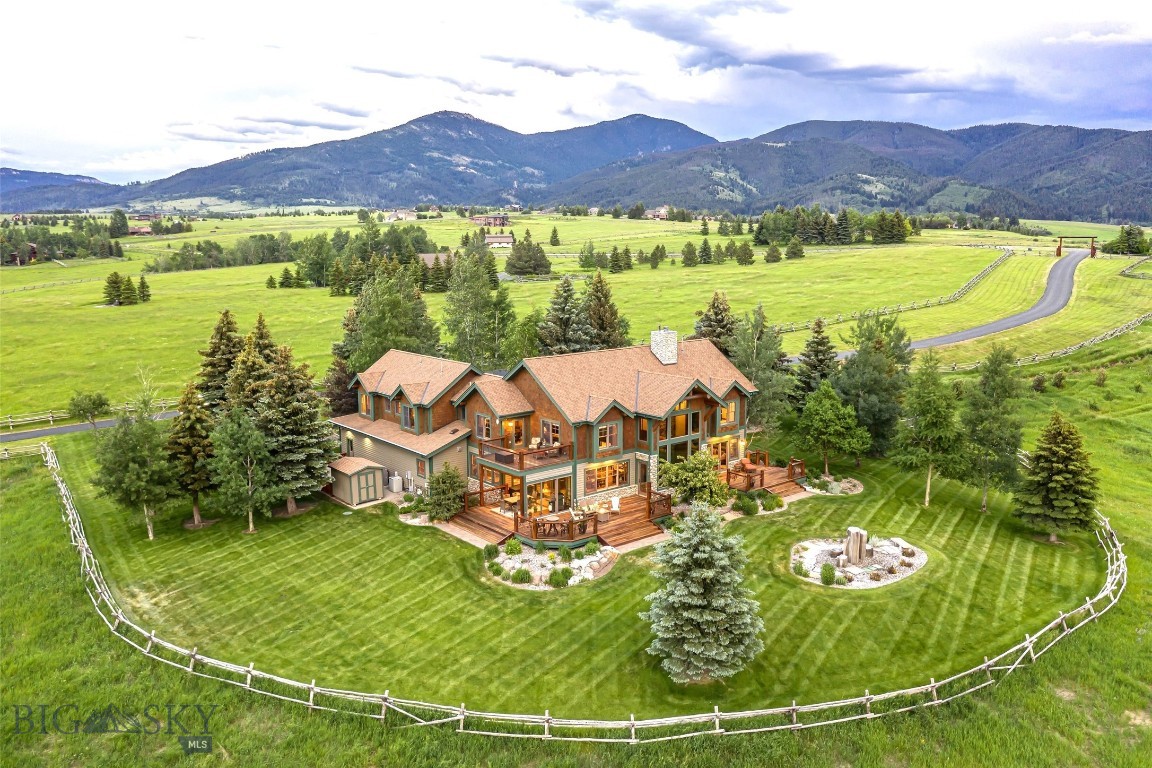
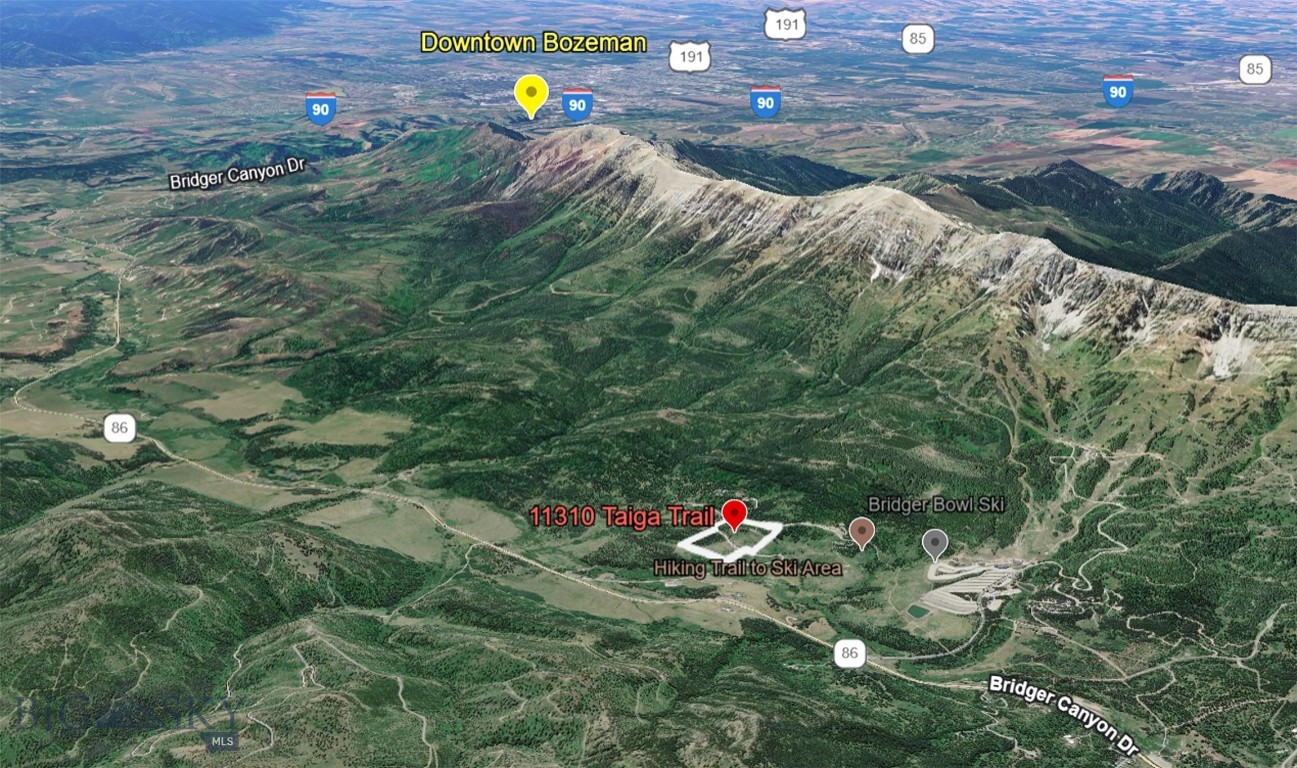
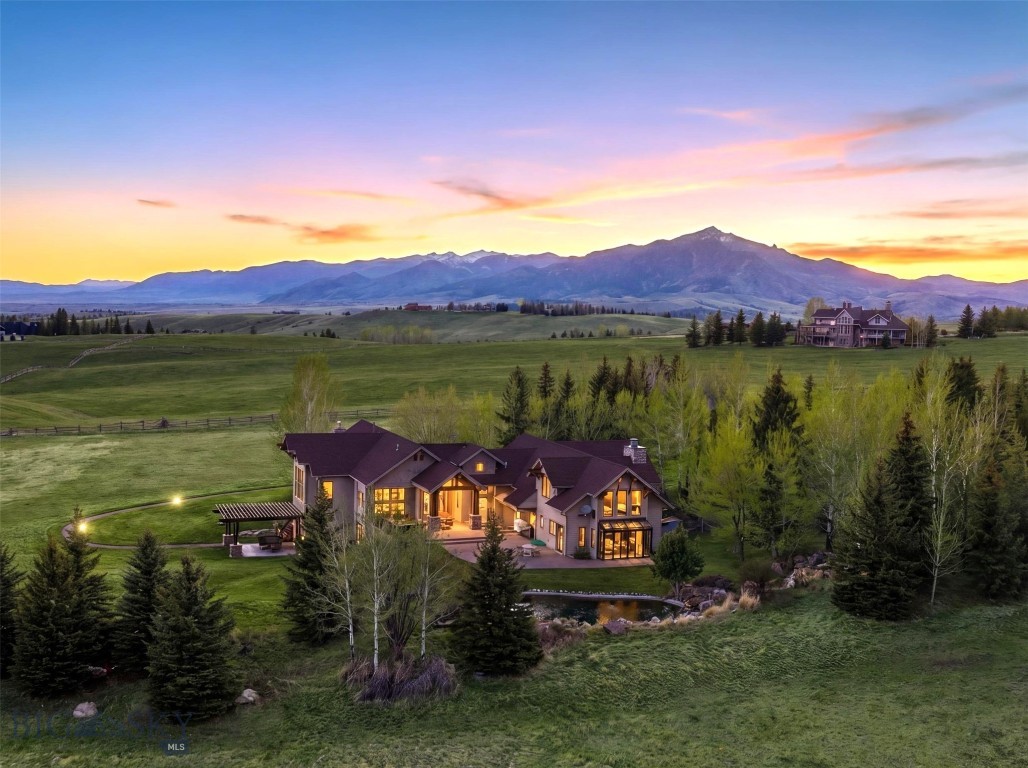
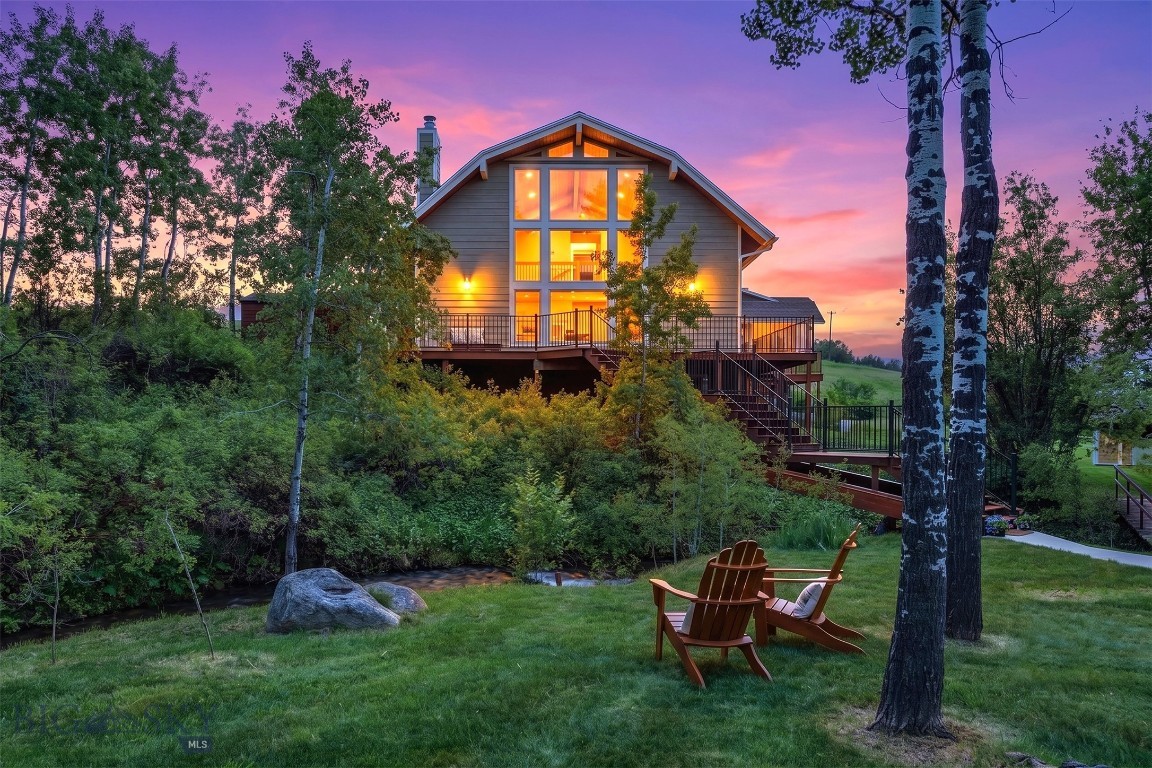
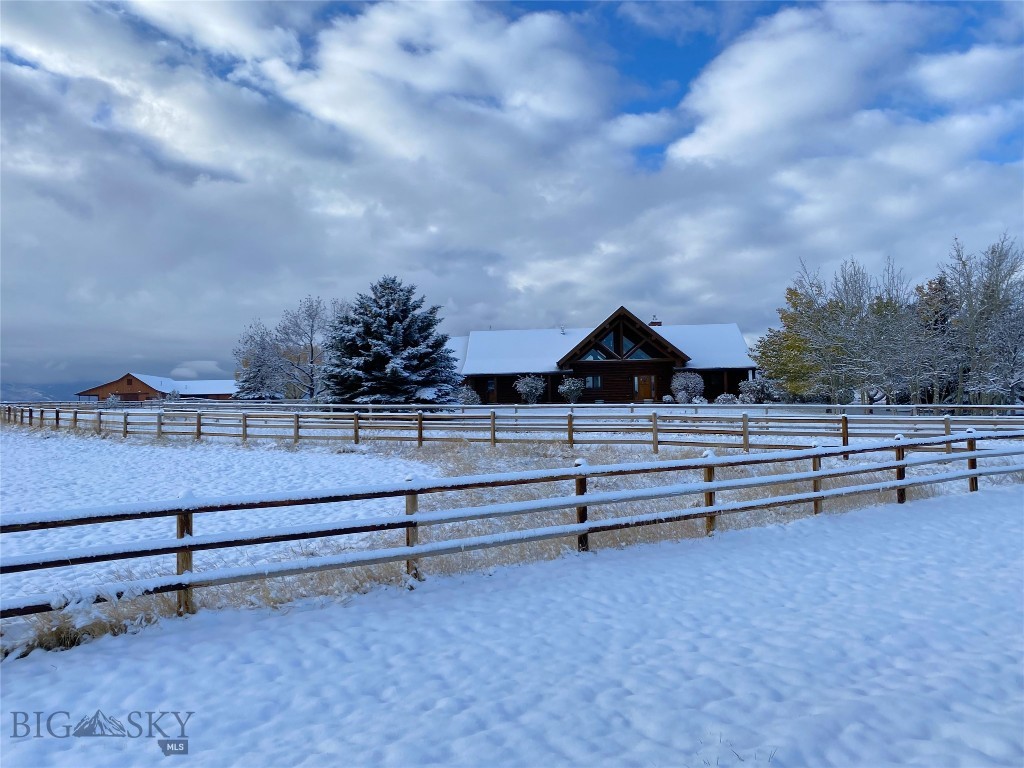
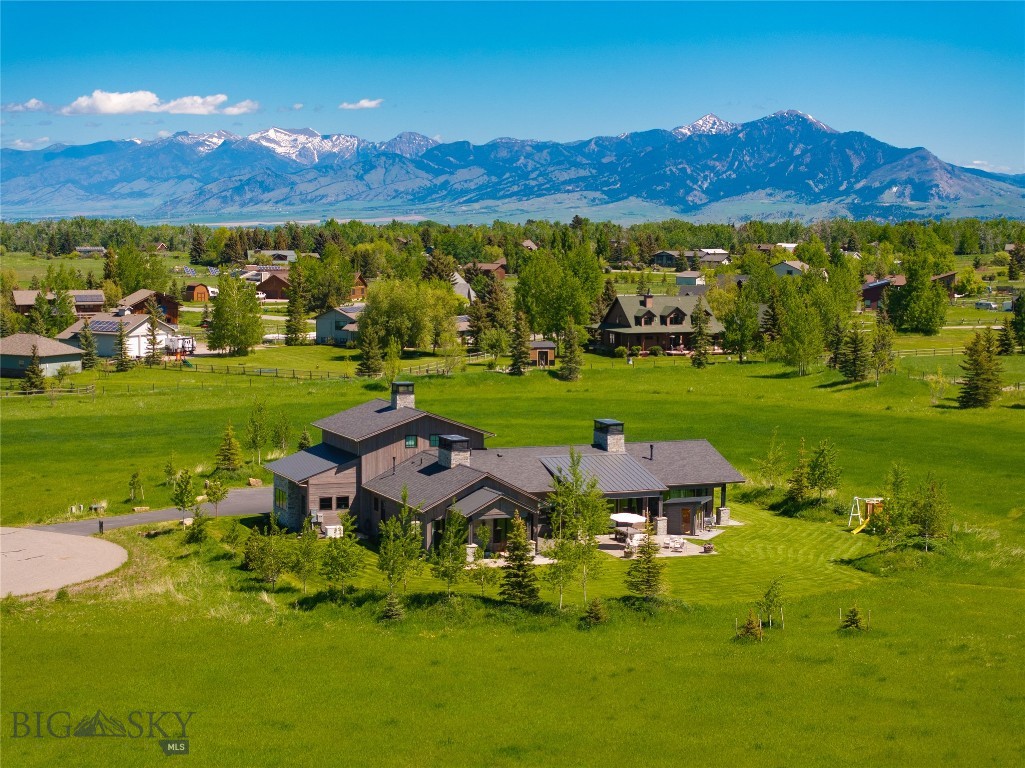
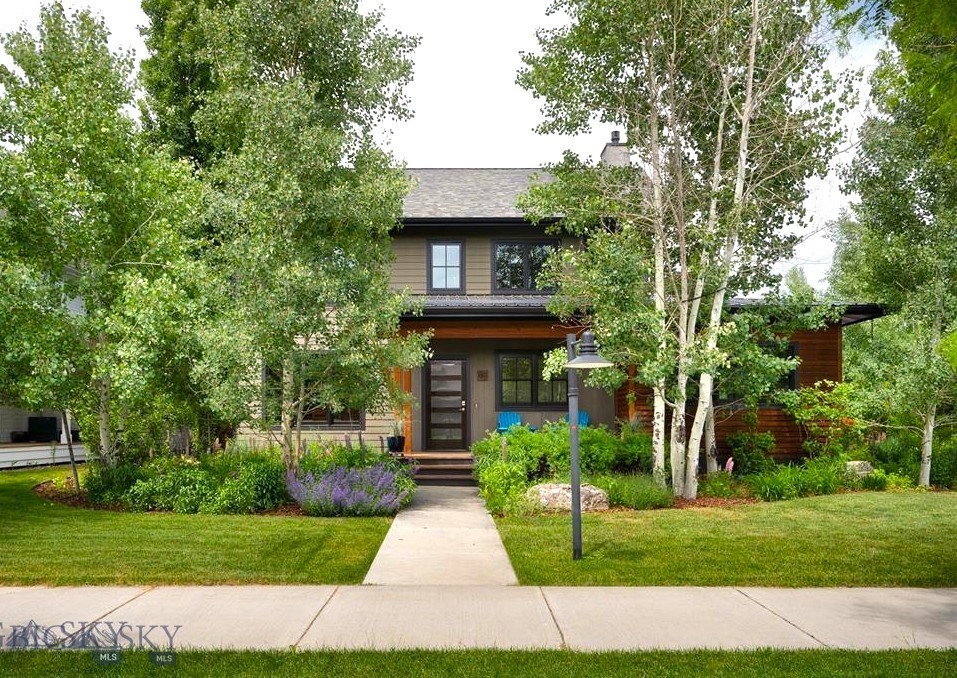
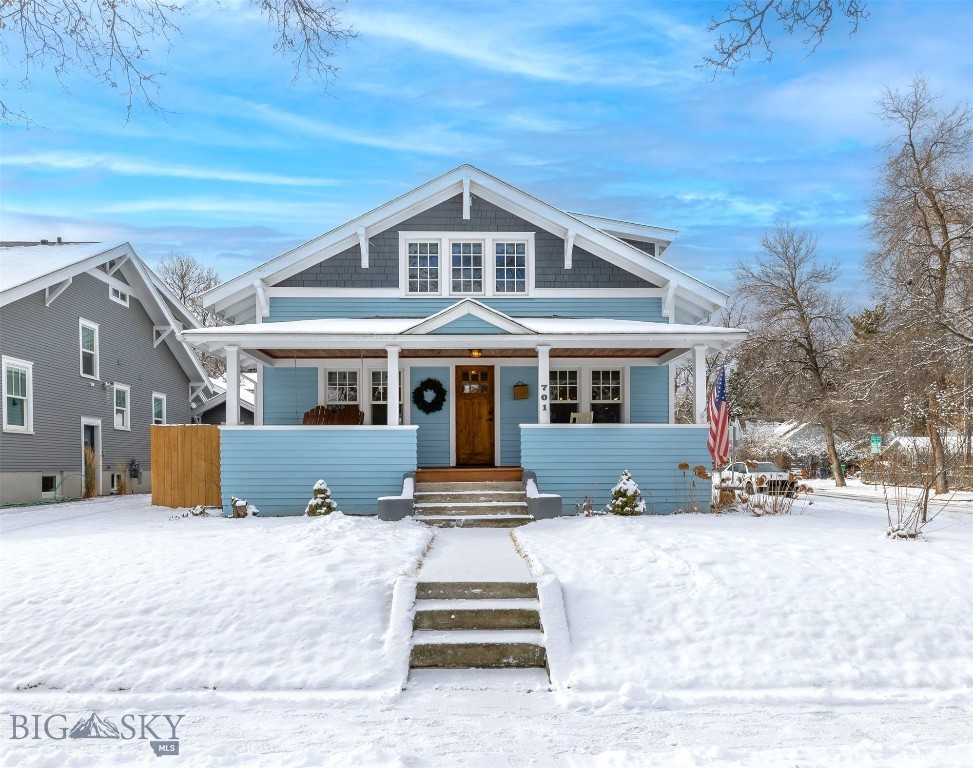
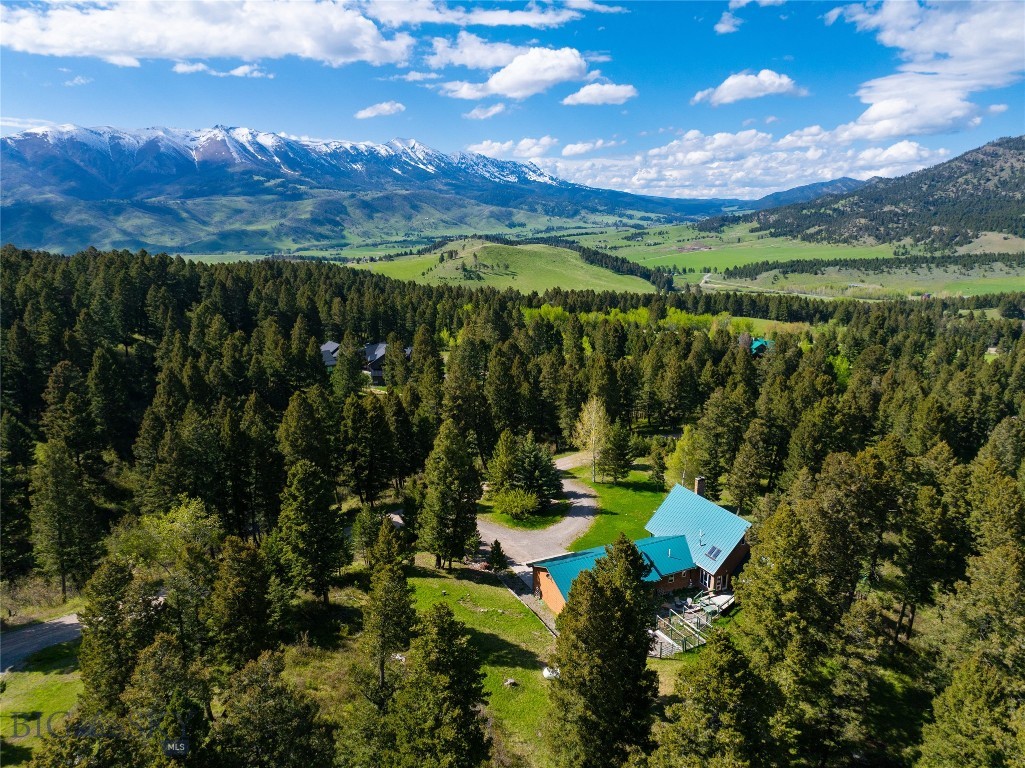
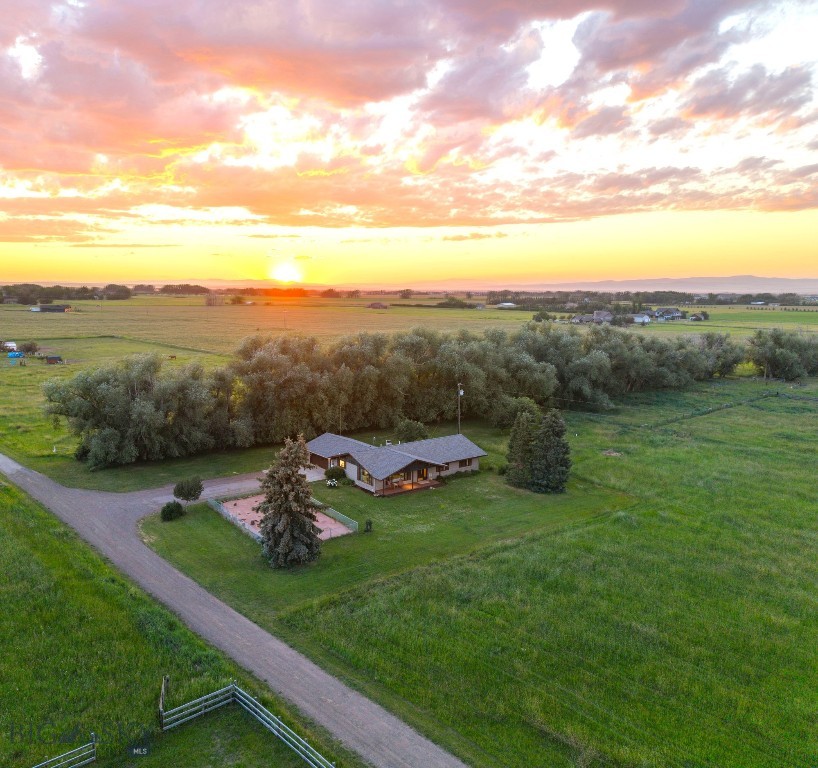
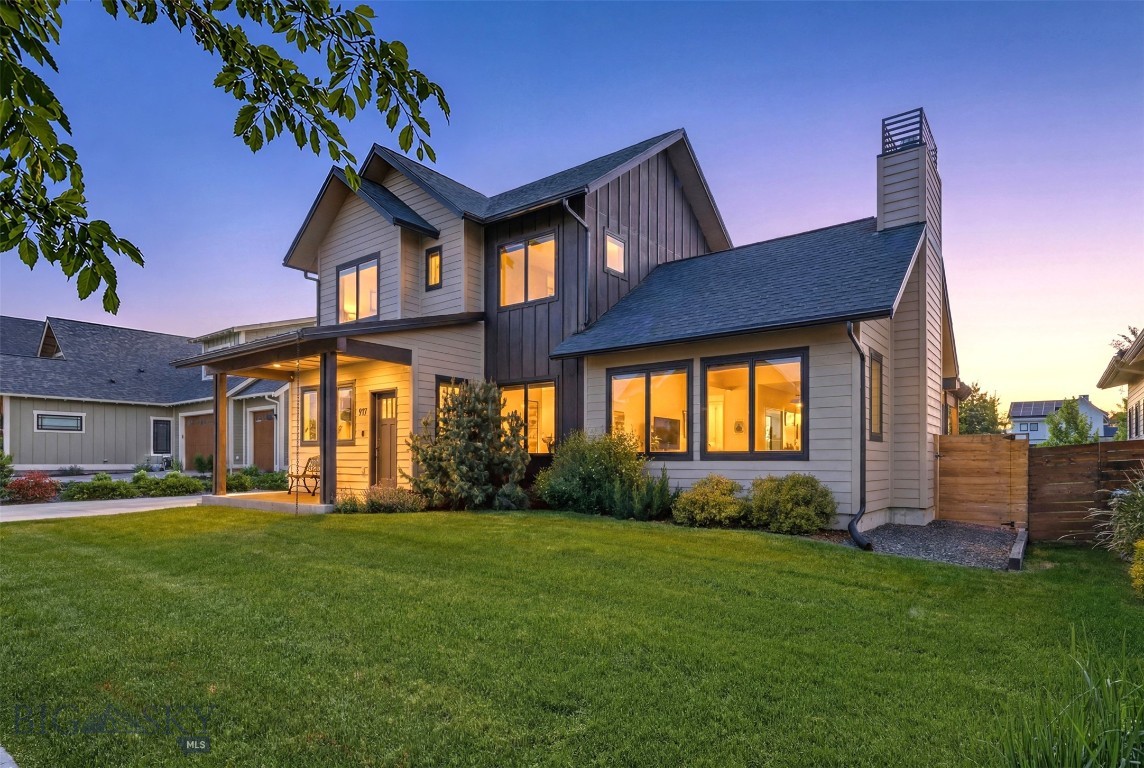
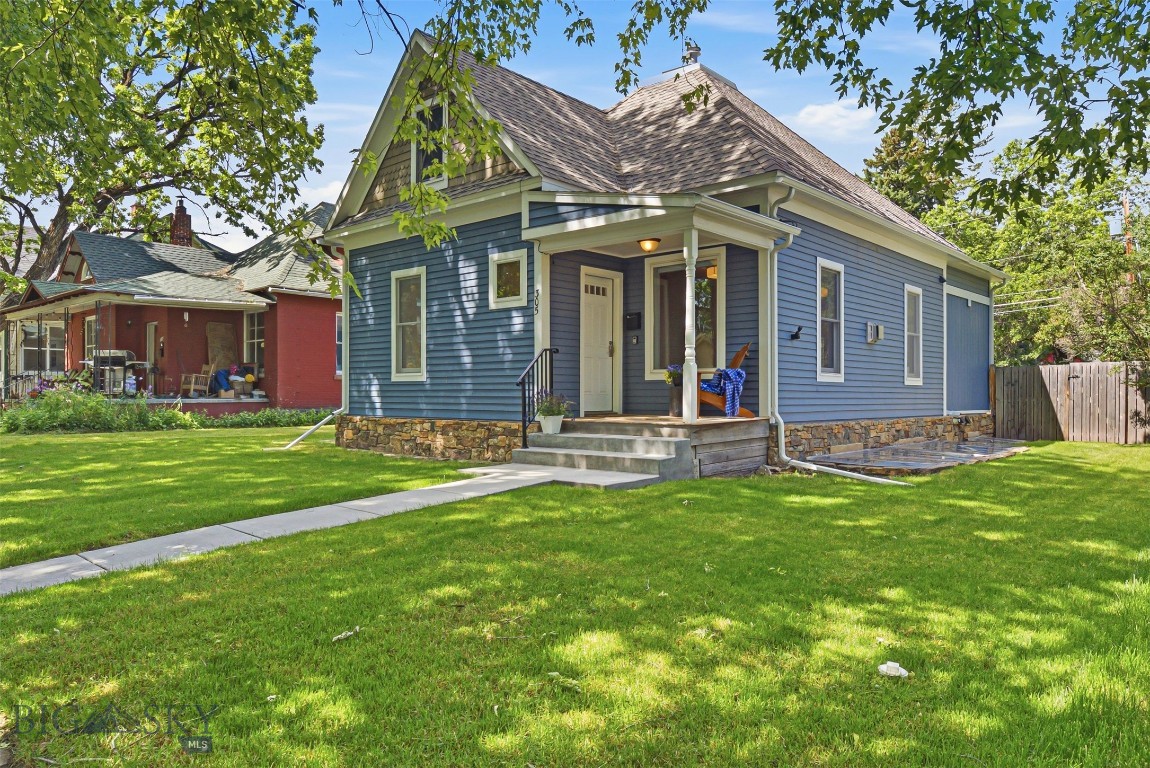
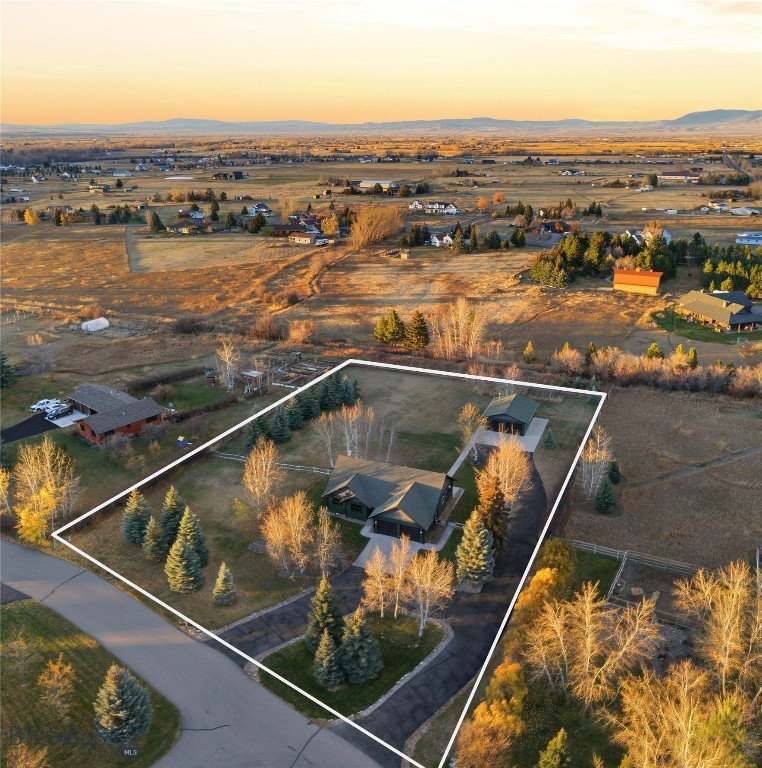
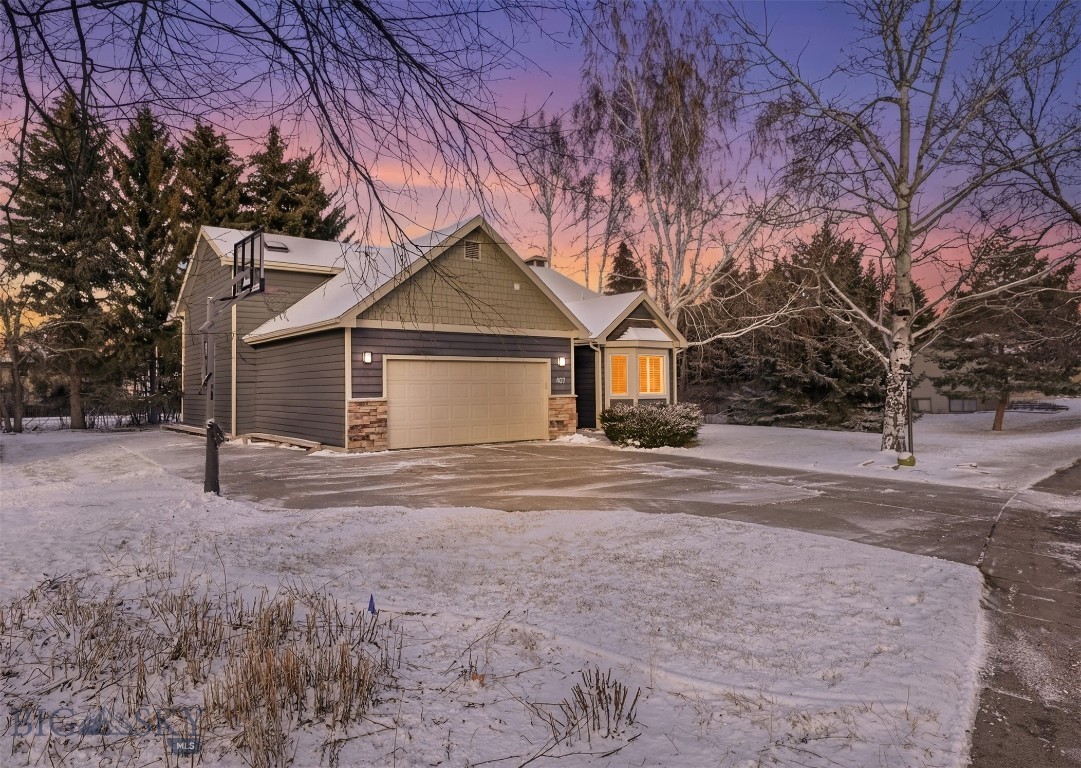
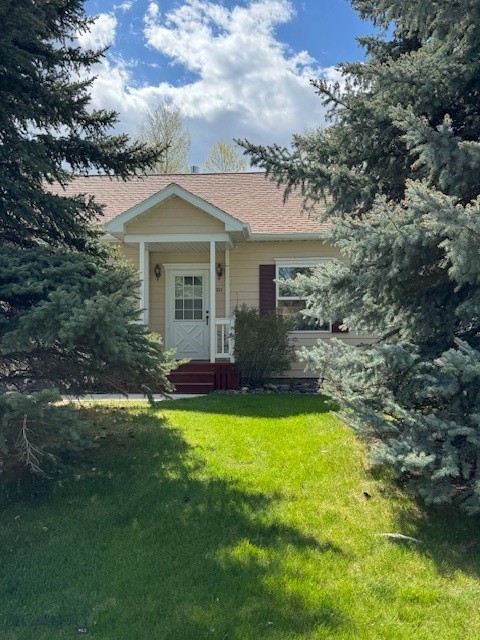
Taunya’s Featured Area Homes and Land for Sale


LISTINGS IN OTHER SOUTHWEST MONTANA CITIES: BOZEMAN LISTINGS – BELGRADE MT LISTINGS – BIG SKY LISTINGS – GALLATIN GATEWAY MONTANA LISTINGS – LIVINGSTON MONTANA LISTINGS – MANHATTAN MT LISTINGS – THREE FORKS MONTANA LISTINGS
 |  |  |  |